This guide is for laboratory technicians, molecular biologists, and QC analysts who use or evaluate micro volume spectrophotometers for nucleic acid and protein quantification. Whether you are selecting a new instrument, troubleshooting inconsistent readings, or writing a standard operating procedure, this article covers the critical measurement principles, common pitfalls, and decision factors you need to get reliable results from a NANO‑series micro volume spectrophotometer.
Why Micro Volume Spectrophotometry Matters for Biomolecule Analysis
Micro volume spectrophotometers have become the workhorse for DNA, RNA, and protein concentration measurements in life science and biopharma laboratories. Their main advantage is clear: they require only 1–2 µL of sample, preserve precious material, and eliminate the need for cuvettes or dilutions in most cases. But that convenience creates a dangerous assumption—that any reading on any instrument is automatically trustworthy. The reality is that the physics of short‑pathlength measurements, sample surface chemistry, and the nature of the analyte matrix can introduce errors that a standard full‑volume UV‑Vis spectrophotometer would not show in the same way.
When you understand why a 260/280 ratio can drift, how a bubble changes the apparent concentration, or when a pedestal measurement is simply not the right tool, you move from blind data collection to confident decision‑making. This article focuses on that practical, experience‑based understanding, especially for users of the NANO family of micro volume spectrophotometers.
How a Micro Volume Spectrophotometer Measures Nucleic Acids and Proteins

At its core, a micro volume spectrophotometer uses the same principle as any UV‑Vis system: light passes through the sample, and absorbance is measured at specific wavelengths. The critical difference is the pathlength. In a traditional 1 cm cuvette, the pathlength is fixed. In a micro volume instrument, the sample forms a liquid column between two optical surfaces—often a pedestal and a movable arm—creating a pathlength of typically 0.2 mm or 0.5 mm. The software then normalizes the absorbance to a 1 cm equivalent using the Beer‑Lambert law.
For nucleic acids, the key wavelengths are:
- 260 nm – maximum absorbance of nucleic acids.
- 280 nm – where proteins and phenol absorb strongly.
- 260/280 ratio – indicator of nucleic acid purity.
- 260/230 ratio – indicator of contamination by salts, carbohydrates, or organic solvents.
For proteins, the absorbance peak near 280 nm (due to tryptophan and tyrosine) is most common, though colorimetric assays (Bradford, BCA, Lowry) are often run at visible wavelengths. Many NANO‑series instruments support both direct UV protein measurement and pre‑programmed colorimetric methods.
The instrument typically measures a tiny drop of 1–2 µL directly on the pedestal. After the measurement, the sample can often be recovered, but that recovery is not always quantitative—a detail many users forget until they are short on a precious sample.
The Pre‑Run Verification That Most Labs Skip

Before trusting any result, you must verify that the instrument is clean, blanked correctly, and that the sample itself is suitable for micro volume measurement. Skipping these steps is the single most common source of erroneous data. Here is a practical verification workflow that takes less than two minutes:
- Clean the pedestal surfaces. Use a lint‑free laboratory wipe and deionized water, then a dry wipe. Do not use organic solvents unless permitted by the manufacturer; some pedestal coatings are sensitive.
- Measure a blank. Pipette the exact same buffer or solvent that the sample is dissolved in—not water, unless the sample is truly in water. Use a fresh aliquot of the blank. A blank that has been sitting on the bench may have evaporated slightly, changing its concentration.
- Verify the blank spectrum. A good blank should show a flat, near‑zero absorbance trace across the measured range. A sloping baseline, especially below 240 nm, indicates residual sample, detergent, or buffer contamination on the pedestal.
- Run a known standard. Use a calibrator or certified reference material, ideally one similar in concentration to the expected sample. The measured concentration should agree within your predefined acceptance criteria (e.g., ±5%). If it does not, do not adjust the instrument; troubleshoot the cause first.
- Re‑blank if needed. After measuring a high‑concentration standard, re‑blank before unknown samples to avoid carryover.
Many operators start by just pipetting the sample and hitting “measure.” That works often enough to create a false sense of security, but when it fails, the root cause is almost always hidden in one of the above checks.
Operator Note: When I train new users, I make them blank three times in a row with fresh buffer. If the second and third blanks don’t match within 0.001 absorbance units, we know the pedestal isn’t truly clean. It saves hours of chasing bad ratios later.
Common False Assumptions About Micro Volume Measurements
Even experienced analysts can fall into habits that erode data quality. The following false assumptions appear repeatedly in molecular biology and protein biochemistry labs:
- “The 260/280 ratio tells me everything about purity.” A good 260/280 ratio (~1.8 for DNA, ~2.0 for RNA) suggests the sample is relatively clean, but it does not detect all contaminants. Residual phenol, for instance, absorbs strongly at 270 nm and can distort the 260/280 ratio only indirectly. The 260/230 ratio is often more sensitive to common extraction leftovers. Relying solely on 260/280 can allow salt‑contaminated or poorly extracted samples to slip through.
- “Any micro volume spectrophotometer gives the same result for proteins.” Protein absorbance is concentration‑ and sequence‑dependent. Micro volume instruments that use a short pathlength may struggle with low‑concentration protein solutions because the absorbance signal is inherently weak. Additionally, surfactants, reducing agents, or buffer components can contribute to the protein absorbance reading, an effect that may be amplified in micro volume configurations due to surface interactions. A dedicated protein assay (Bradford, BCA) run in a cuvette or plate reader may be more robust for critical quantification.
- “If the pedestal is clean, the measurement is accurate.” A clean pedestal is necessary but not sufficient. Sample inhomogeneity, incomplete column formation, evaporation during measurement, and bubbles all produce false readings that look perfectly normal on the display.
- “I can always recover my sample after measurement.” While many NANO instruments allow sample recovery, the process often recovers only 80–90% of the original volume. If your downstream application is extremely volume‑sensitive, plan to measure a dedicated aliquot rather than the entire precious sample.
Troubleshooting Inconsistent Results: From Symptoms to Root Causes
Micro volume spectrophotometers are robust, but small deviations in technique produce large measurement errors. The table below links common symptoms to underlying causes and practical corrections.
| Symptom | Likely Cause | Why It Happens | Corrective Action | Prevention |
|---|---|---|---|---|
| High variability between replicate drops | Inconsistent column formation or sample mixing | Small differences in how the drop spreads between the pedestal surfaces change the effective pathlength. Air bubbles or particulates add to the variability. | Vortex the sample briefly, centrifuge to remove particulates, and pipette a fresh aliquot slowly. Avoid drawing the pipette tip along the pedestal edge. | Always use a fresh aliquot for each measurement; do not reuse the same drop. |
| 260/280 ratio consistently outside expected range | Blank mismatch or pedestal residue | If the blank is not exactly the sample solvent, or if carryover from a previous high‑concentration sample remains, the spectrum shifts. | Clean pedestals thoroughly with DI water, then with 60% isopropanol if needed. Re‑blank with the precise sample buffer. | Run a blank check after every 5–10 samples; always inspect the blank spectrum. |
| Negative or zero concentration readings | Baseline offset or sample concentration below detection limit | A dirty pedestal can produce a negative baseline correction. Very low concentrations (< 2 ng/µL for nucleic acids) may fall below the reliable range. | Clean and re‑blank. If concentration is expected to be very low, concentrate the sample or use a fluorescence‑based method (e.g., Qubit). | Understand the lower limits of your specific NANO model; do not force micro volume for ultra‑low concentrations. |
| 260/230 ratio < 1.5 for DNA | Residual phenol, guanidine, or carbohydrate contamination | Many extraction kits leave behind trace organics that absorb at 230 nm. | Re‑precipitate the DNA or perform an additional wash step with ethanol. | Always include a 260/230 ratio check in QC acceptance criteria. |
| Signal drift over time | Evaporation or lamp instability | Small drop volumes evaporate quickly, especially in warm labs. Over minutes, concentration appears to increase. Lamp aging also causes slow drift. | Measure each sample immediately after pipetting. Run standard checks more frequently to detect lamp drift. | Control room temperature and humidity; perform regular lamp intensity checks per manufacturer. |
| Protein A280 readings inconsistent | Buffer absorbance contribution or non‑specific scattering | Many protein buffers (e.g., Tris, reducing agents) absorb near 280 nm, and aggregates cause light scattering that inflates apparent absorbance. | Use the same buffer for blank and sample. If aggregates are suspected, filter or centrifuge the sample. | For critical protein work, consider a colorimetric assay or measure absorbance at 205 nm with caution. |
Operator Note: I once spent an entire afternoon chasing a 260/280 ratio that kept giving 2.2 for a DNA sample. After cleaning, re‑blanking, and re‑prepping the sample, the issue was the TE buffer stored in a plastic tube that had leached UV‑absorbing compounds. Switching to a glass vial solved the problem instantly.
When a Micro Volume Spectrophotometer Is Not the Right Tool

Despite their popularity, micro volume measurements are not universally superior. There are clear limits where other techniques outperform pedestal‑based spectrophotometry:
- Concentration below ~2 ng/µL for DNA. Most micro volume systems have a lower reliable detection limit in the low ng/µL range. For samples such as dilute NGS libraries, a fluorescence‑based assay (Qubit, PicoGreen) provides far better sensitivity and accuracy.
- Samples with high light scattering. Turbid samples, such as some protein‑DNA complexes or virus‑like particles, do not follow the Beer‑Lambert law linearly due to scattering. A cuvette‑based spectrophotometer with integrating sphere or a different detection principle may be needed.
- Matrix containing high concentrations of UV‑absorbing excipients. Formulation buffers with aromatics or surfactants can dominate the spectrum, making direct A280 or A260 unreliable without careful background subtraction or a colorimetric assay.
- When absolute protein concentration accuracy is required for final release testing. A colorimetric assay with a well‑matched protein standard remains the gold standard; direct UV absorbance is an estimation that varies with amino acid composition.
Recognizing these limits is not a weakness of the instrument—it is a strength of the analyst who knows when to choose an alternative method.
Selecting the Right NANO Series Spectrophotometer for Your Workflow
Not all micro volume instruments are the same. The AELAB NANO series includes several models tailored to different throughput, wavelength coverage, and software requirements. While a generic micro volume specification might satisfy occasional users, labs with daily routine use benefit from matching the instrument to the specific application profile.
When evaluating a NANO series spectrophotometer, consider these selection factors:
- Wavelength range. Basic nucleic acid and protein work requires 230–280 nm, but if you also perform dye‑labeled sample analysis, cell culture monitoring, or enzyme assays, a model extending into the visible range (up to 600 nm or beyond) is necessary.
- Pre‑programmed methods. Built‑in routines for dsDNA, ssDNA, RNA, oligos, protein A280, and colorimetric assays reduce operator error and streamline training. Some NANO models include custom method programming for your own protocols.
- Sample volume and pedestal design. While the standard 1–2 µL is common, some models accommodate slightly different sample handling. Consider whether you work with volatile solvents that require a sealed measurement mode.
- Throughput. If you run hundreds of samples per day, a model with fast cycle time and data export capabilities to LIMS or a network folder will save hours over manual transcription.
- Validation support. For regulated laboratories, features such as user access control, electronic signatures, audit trails, and built‑in performance verification routines are critical. The NANO‑600 model, for instance, is frequently chosen by labs needing IQ/OQ documentation.
-
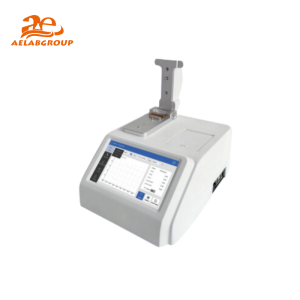 AELAB Micro Volume Spectrophotometer NANO-300 – Precision DNA/RNA AnalysisRead more
-
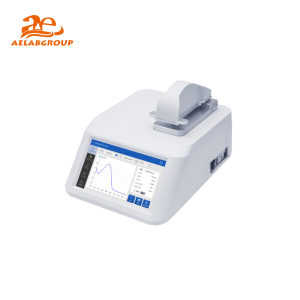 AELAB Micro Volume Spectrophotometer NANO-400A – Precision for Micro-Sample Analysis$2,680.00 Select options This product has multiple variants. The options may be chosen on the product page
-
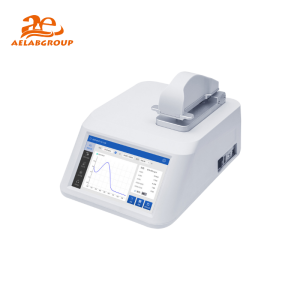 AELAB Micro Volume Spectrophotometer NANO-600 – Precision AnalysisRead more
-
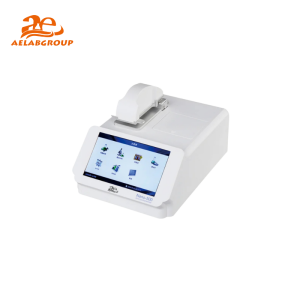 AELAB NANO-500 Micro Volume Spectrophotometer – High-Precision Biomolecule AnalysisRead more
-
 Micro Spectrophometer NANO-100Read more
The shortcode above displays available NANO series micro volume spectrophotometers. Use it to compare models side‑by‑side and identify which one aligns with your primary application, required wavelength range, and compliance needs. A dedicated instrument specialist can help you map your daily sample types and workflow to the most appropriate configuration.
Building Confidence in Your Results Over Time
A micro volume spectrophotometer becomes a reliable partner only when you treat it as an analytical instrument, not a magic black box. That means regular performance checks, meticulous blanking, and a healthy skepticism of ratios that look too good to be true. The NANO series instruments are engineered to make this daily discipline easier, with guided software, automatic baseline corrections, and contamination alerts—but no technology replaces the operator’s judgment.
Integrate a simple system suitability test (SST) into your daily routine: a clean blank, a known standard at a typical working concentration, and a buffer check. That five‑minute practice will catch most problems before they reach your precious samples.
Conclusion: From Data Points to Decision‑Ready Results
Micro volume spectrophotometry has transformed how molecular biologists and protein biochemists quantify their samples. The speed and low‑volume convenience are undeniable. But the real value lies in the careful technique, the understanding of spectral pitfalls, and the deliberate choice of instrument features that match your lab’s reality. The NANO series spectrophotometers provide a range of options to support this, whether you are running a handful of samples in a research lab or releasing batches in a regulated production environment.
Do this next: Choose one known standard in your lab—ideally a DNA standard you use frequently—and measure it five times on your current micro volume spectrophotometer using the pre‑run verification workflow described above. Compare the results to your expected concentration and purity ratios. If the variability exceeds your acceptable limits, address the root cause before relying on the instrument for unknown samples. A small time investment now prevents days of lost work later.
Frequently Asked Questions
What sample volume is really needed for a micro volume spectrophotometer?
Most NANO series models require only 1–2 µL of sample. However, the volume you pipette should be enough to form a stable liquid column between the pedestal surfaces. If the volume is too low or the sample contains particulates, you may see inconsistent readings. It is best practice to use a freshly aliquot 2 µL and ensure the drop fully contacts both surfaces.
Why does my 260/280 ratio keep changing when I measure the same sample?
An inconsistent 260/280 ratio is most often due to pedestal contamination, an incorrect blank, or evaporation. First, thoroughly clean the pedestal with water and then with 60% isopropanol. Re‑blank with the exact sample buffer. Measure a fresh aliquot and avoid vortexing after the drop is on the pedestal. If the ratio still varies, check the sample for particulates by centrifuging it briefly.
Can I use a micro volume spectrophotometer for protein concentration without a colorimetric assay?
Yes, direct A280 measurements are common and supported on the NANO series. However, the accuracy depends on knowing the protein’s extinction coefficient and having a relatively pure sample. For complex mixtures or when high accuracy is required for release testing, a Bradford or BCA assay is more reliable. The instrument can also measure these colorimetric assays if they are run at the appropriate visible wavelength.
How do I decide between the NANO‑100 and NANO‑600 models?
The choice depends on your wavelength needs and regulatory requirements. The NANO‑100 typically covers the UV range up to 280 nm, sufficient for most nucleic acid and protein A280 work. The NANO‑600 extends the wavelength range farther into the visible spectrum, enabling quantification of dye‑labeled samples, cell density measurements, and certain colorimetric assays. Additionally, the NANO‑600 often includes advanced software features for 21 CFR Part 11 compliance, user management, and audit trails, making it better suited for regulated environments.
Is my sample recoverable after measurement?
In most NANO series micro volume spectrophotometers, you can recover the sample by pipetting it back from the pedestal. However, recovery is rarely 100%—a small amount may be lost to evaporation or surface adhesion. If the sample is extremely precious, it is safer to dedicate a small aliquot for measurement rather than risking the entire volume.
How often should I clean the pedestal surfaces?
Clean the pedestal before the first measurement of the day, between different sample types or buffers, after measuring high‑concentration samples, and whenever the blank spectrum appears abnormal. A quick cleaning with a lint‑free wipe and deionized water after each session is sufficient for routine use. A more thorough cleaning with isopropanol once a week helps prevent film buildup.