This guide is for laboratory managers, QC supervisors, and research scientists who need to identify a fluorescence spectrophotometer that can reliably handle trace-level analysis. Whether you are setting up a new method, replacing an aging instrument, or pushing detection limits in environmental, pharmaceutical, or biochemical work, this article will help you move past brochure specs and understand what truly determines high‑sensitivity performance—and how to evaluate it before you commit.
Why High Sensitivity Matters in Fluorescence Analysis
Fluorescence spectroscopy is inherently sensitive compared to absorbance methods because it measures emitted light against a dark background. However, not all fluorescence spectrophotometers deliver the same low-end performance. High sensitivity becomes critical when you work with dilute samples, low-quantum-yield fluorophores, small sample volumes, or applications where the analyte concentration is near the detection limit. In regulated environments like pharmaceutical impurity profiling or environmental PAH analysis, poor sensitivity can mean missed out‑of‑specification results and failed method validation.
The real question isn’t just “how low can it go” according to the specification sheet. The question is whether that detection limit holds up under real laboratory conditions—with routine samples, realistic integration times, and the sample matrices you actually handle.
Key Components That Drive Detector Sensitivity

Sensitivity in a fluorescence spectrophotometer is never the result of a single component. It is a system property, and the weakest link determines the floor. The light source must provide high irradiance at the excitation wavelength, but stability over time is equally important. High‑pressure xenon arc lamps are common, but their output decays gradually. Pulsed xenon sources can improve signal‑to‑noise ratio by enabling lock‑in detection, yet they may not cover the full UV range uniformly if the excitation monochromator is not well matched.
The detector is often the first feature buyers look at. Photomultiplier tubes (PMTs) remain the gold standard for sensitivity, but PMT quality and spectral response vary widely. Red‑sensitive PMTs are essential for work beyond 600 nm, and many labs overlook this until they attempt to measure far‑red fluorophores and find the signal disappearing. A cooled PMT housing reduces dark current, which directly improves the signal‑to‑noise ratio for weak emissions.
Monochromators also play an underrated role. Stray light rejection, grating efficiency, and bandwidth all influence how much excitation light reaches the sample and how much of the weak emission reaches the detector. A fluorescence spectrophotometer with a poor excitation monochromator can scatter more light into the emission path, artificially raising the blank and masking low signals.
Operator Note: When evaluating a new instrument, always ask for a sample scan of a low‑concentration fluorophore in your real solvent, not just a standard provided by the vendor. The difference between a pure water test and a buffer or serum test can change the detection limit by an order of magnitude.
Signal, Noise, and the Baseline: What Actually Limits Sensitivity
The detection limit is defined by the ratio of signal to noise. A thoughtful selection focuses less on the absolute lamp power and more on the noise floor. Drift, flicker noise from the lamp, detector dark counts, and electronic noise all contribute. A spectrophotometer that averages many scans or has a high‑speed digital signal processor can reduce noise, but only if the noise is random. Systematic drift from a warming‑up lamp or a poorly designed sample compartment cannot be averaged away.
Raman scattering from water is often used as a quick test of sensitivity. The Raman band of water at 350 nm excitation yields a weak peak at around 397 nm. A high‑sensitivity instrument should show this peak with a signal‑to‑noise ratio that meets the manufacturer’s specification. However, labs sometimes misinterpret a high Raman S/N value as proof that the instrument will handle all analytes equally well. A strong Raman peak indicates good UV sensitivity but tells you nothing about red‑end PMT performance or how the instrument handles high‑background samples.
Matching Instrument Features to Real Lab Demands
Not every high‑sensitivity lab needs the same toolset. A core pharmaceutical QC lab performing a validated method with fixed wavelengths may require a robust, reproducible spectrophotometer with audit trail and IQ/OQ documentation, while a university research group studying novel near‑IR probes may prioritize a wide spectral range, interchangeable detectors, and a flexible software platform for method development. The table below highlights typical application profiles and the features that matter most.
| Application Type | Critical Sensitivity‑Related Features |
|---|---|
| Pharma method validation / QC | Long‑term signal stability, validated software, traceable calibration, low drift |
| Environmental trace analysis (PAH, pesticides) | Deep UV performance, low stray light, high PMT gain linearity |
| Biochemical / cell‑based assays | Micro‑volume capability, fast scanning, plate reader accessory compatibility |
| Materials science (quantum dots, perovskites) | Wide wavelength range, red‑sensitive PMT, polarization accessories |
When shortlisting instruments, ask for a demonstration using a sample that closely matches your lowest expected concentration and matrix, not a clean standard that inflates the apparent performance.
False Assumptions That Lead to Wrong Instrument Selection

Even experienced scientists can be misled by a few common beliefs that do not hold up in daily use. Recognizing these early prevents a costly mismatch.
Assumption 1: A higher wattage lamp always gives better sensitivity. Lamp power matters, but if the noise from the lamp is proportionally higher or the optics do not efficiently couple the light into the monochromator, the raw wattage becomes irrelevant. A well‑collimated 150 W xenon source can outperform a poorly integrated 300 W lamp.
Assumption 2: The specified detection limit in the brochure will be achieved with real samples. Manufacturer detection limits are typically measured under idealized conditions: pure water, long integration times, and often a single, highly fluorescent standard. Real biological or environmental matrices introduce background fluorescence and scattering that can raise the practical detection limit by a factor of 10 or more. Always verify detection limits in a matrix representative of your work.
Assumption 3: All photomultiplier tubes (PMTs) are equivalent. PMTs differ in quantum efficiency across the spectrum, dark current, and dynamic range. A standard PMT that excels in the visible range may be nearly blind above 800 nm. If your application pushes into the near‑IR, you need a red‑enhanced PMT, even if the instrument’s claimed spectral range extends that far.
Assumption 4: A wider spectral bandwidth always improves sensitivity without sacrificing resolution. Opening the slits lets in more light, but it also increases stray light and reduces spectral resolution. For samples with overlapping emission peaks, this can lead to false positives or quantification errors. The bandwidth must be matched to the spectral features of the analyte, not simply set to maximum.
Evaluating a Fluorescence Spectrophotometer Before You Commit

A meaningful evaluation goes beyond comparing datasheets. Follow this structured approach to see how an instrument behaves under conditions close to your own.
- Prepare a representative test solution. Use your most challenging sample matrix, spiked with the analyte at a concentration 2‑5× the expected detection limit.
- Measure the signal‑to‑noise ratio under your typical scan parameters. Do not accept factory‑preset slow scans that you would never use in production.
- Perform a dilution linearity series. Run at least five concentrations spanning the lower end of your working range and check the correlation coefficient. Poor linearity at low concentrations often indicates insufficient sensitivity or stray light issues.
- Run a long‑term stability test. Monitor the fluorescence intensity of a blank and a standard over 1‑2 hours. Drift greater than a few percent suggests thermal instability or lamp aging that will compromise your detection limit during long runs.
- Evaluate software capability. Can the software easily perform blank subtraction, calculate signal‑to‑noise, and export data into your LIMS or analysis pipeline? A heavy manual workaround will cost more over time than a slightly more expensive instrument with better data handling.
Where many labs start incorrectly is assuming that a quick demonstration with the vendor’s own standard is enough. Push the instrument outside its comfort zone—run a high‑background sample, scan at the speed you need for routine work, and see if the sensitivity holds.

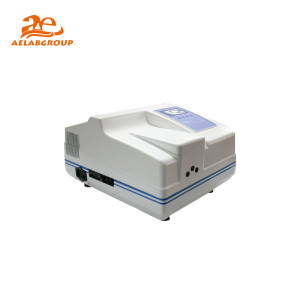

Solutions for High‑Sensitivity Fluorescence Work
Once you have defined the sensitivity requirements and tested them against real‑world conditions, instrument selection becomes a matter of matching your lab’s operational profile. The AELAB fluorescence spectrophotometer range includes models likely suited for different balances of sensitivity, throughput, and automation. For example, the F98 series appears intended for laboratories that need top‑tier detection limits, research‑grade PMT performance, and flexible data handling—typical of method development and ultra‑trace analysis. The F96Pro, on the other hand, may be a more practical choice for routine high‑sensitivity work, offering reliable performance with a focus on ease of use and cost efficiency. Both can be evaluated against the checklist described earlier, and AELAB can often arrange an on‑site demonstration so you can verify performance with your own critical samples.
Maintaining Performance: Why Sensitivity Fades Over Time
Even the best spectrophotometer will lose sensitivity if preventive maintenance is ignored. The following table lists common symptoms, root causes, and corrective actions that keep the instrument performing at its original detection limit.
| Symptom | Likely Cause | Why It Happens | Corrective Action | Prevention |
|---|---|---|---|---|
| Gradual loss of signal across the whole spectrum | Lamp aging | Xenon lamps lose intensity over hundreds of hours; the UV output drops faster than visible | Replace lamp and re‑validate | Monitor lamp hours; keep a log and replace preventively before a critical batch |
| Increased noise, especially at high PMT gain | Detector dark current rise | PMT housing temperature may be elevated; cooling fan failure or dust buildup | Clean ventilation, check fan, run detector dark scan | Annual PMT recalibration and housing inspection |
| High blank reading, poor detection limit | Stray light due to dirty optics or grating misalignment | Dust, sample spills, or mechanical shock can scatter excitation light into emission path | Professional cleaning of monochromator and sample compartment | Use cuvette caps, keep compartment sealed, schedule optical service |
| Non‑linear standard curve at low concentrations | Sample matrix scatter or inner filter effect not corrected | Highly absorbing samples reduce excitation intensity reaching the fluorophore; nonlinear response even at low analyte levels | Dilute sample if possible, or correct mathematically | Validate linearity in each matrix; set an upper absorbance threshold |
Regular performance verification with a stable fluorescent standard—such as a sealed cuvette containing a dye solution—can catch sensitivity drift before it impacts results. In regulated laboratories, this verification should be part of the system suitability test and documented.
Decision Checklist by Lab Type
How you prioritize sensitivity factors depends on your lab’s regulatory and throughput context. Use the checklist below to guide your evaluation.
- Routine QC / GMP lab: Stability, validated software, audit trails, predictable maintenance intervals, and local service support often outweigh the need for the absolute lowest detection limit.
- High‑throughput screening lab: Fast scanning, plate reader compatibility, and automated data export are essential; sensitivity must be balanced with speed.
- Academic research lab: Maximum flexibility in wavelength range, interchangeable accessories, and the ability to modify spectral parameters are more important than pre‑validated methods; sensitivity to a wide range of fluorophores is key.
- Environmental monitoring lab: Deep UV performance (240‑300 nm) and low stray light for PAH analysis; often requires robust long‑term baseline stability due to unattended overnight runs.
Bringing It All Together
Selecting a fluorescence spectrophotometer for high‑sensitivity work is a decision that must be based on how the instrument behaves with your samples, not only on published specifications. The interaction between light source, optics, detector, and sample matrix sets the real detection limit. False assumptions about lamp power, PMT quality, or bandwidth can easily lead to an instrument that underdelivers. A structured evaluation—including stability tests, dilution linearity, and matrix‑matched detection limit determination—provides the evidence you need to choose confidently.
High sensitivity is not just a feature; it is a system property that must be maintained through proper installation, regular verification, and a clear understanding of what can degrade it. Whether you are pushing the limits of trace analysis or simply need reliable quantitation at low levels, the right choice is the one that continues to perform day after day, not the one that looked best on paper.
Do this next: Request an on‑site demonstration of the fluorescence spectrophotometer you are considering, using your most challenging low‑concentration sample in its real matrix, and run a 30‑minute stability test plus a dilution linearity series to confirm that the sensitivity meets your laboratory’s actual needs.
Frequently Asked Questions
What is the difference between a fluorometer and a fluorescence spectrophotometer?
A fluorometer typically uses filters for wavelength selection and is designed for fixed‑wavelength measurements, making it simpler and cheaper but less flexible. A fluorescence spectrophotometer uses monochromators and can scan both excitation and emission spectra, giving full spectral information essential for method development, multi‑component analysis, and detecting interferences.
What detection limit should I expect from a high‑sensitivity fluorescence spectrophotometer?
There is no single number because it depends on the analyte, matrix, and measurement conditions. A well‑designed instrument can often detect sub‑parts‑per‑billion levels of a strongly fluorescent compound in pure water, but real samples with background fluorescence may raise the practical detection limit considerably. Always verify detection limits in your own matrix during evaluation.
How often should I calibrate a fluorescence spectrophotometer?
Wavelength accuracy can be checked with a standard lamp or a known fluorescent standard monthly or before critical work. For intensity calibration, a daily system suitability test with a stable fluorescent reference is common in regulated labs. Full photometric calibration may be performed annually or after a lamp change.
Can I use a fluorescence spectrophotometer for solid samples?
Yes, many models can accommodate a solid sample holder accessory. However, measuring solids introduces additional variability due to surface scattering and orientation. It is more common in research settings, and sensitivity can be lower than for clear liquids. Check if the instrument’s sample compartment can accept a front‑surface accessory and whether sensitivity is adequate for your solid samples.
Is the AELAB F96Pro suitable for trace pharmaceutical analysis?
The AELAB F96Pro is likely a strong fit for routine high‑sensitivity work where reliability, ease of use, and cost effectiveness are important. For ultra‑trace method development requiring the lowest possible detection limit, the F98 series may be a more appropriate choice. A demo with a representative sample is the best way to confirm that the model meets your specific detection requirements.
What maintenance is most critical for preserving sensitivity?
Lamp replacement before significant intensity drop, keeping optics clean, and verifying the detector dark current annually are the three most important actions. Regular cuvette compartment cleaning prevents stray light from sample residue, and using high‑quality cuvettes with consistent geometry reduces variability that can be mistaken for sensitivity loss.