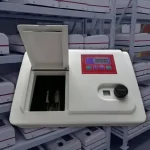
Reliable DNA, RNA, and protein quantification is essential in molecular biology, biochemistry, biotechnology, and laboratory quality control. However, accurate results depend on more than selecting a spectrophotometer that can display absorbance at 260 or 280 nm.
The analytical method, sample purity, cuvette material, optical pathlength, blank solution, photometric linearity, stray light, wavelength performance, and data-processing workflow all influence the final result.
This guide explains how to select a UV-Vis spectrophotometer for DNA and protein quantification, how nucleic-acid and protein measurements differ, and which specifications should be confirmed when comparing the AELAB AE-SP1000, AE-SP2000, AE-SP3000, AE-SP4000, and AE-SP5000 series.
Important: Published specifications are useful for initial comparison, but they do not replace method verification. Final performance should be confirmed using the intended sample, cuvette, assay, concentration range, and laboratory acceptance criteria.
Quick DNA and Protein Quantification Decision Guide
| Analytical Need | Suitable Approach | Key Requirement |
|---|---|---|
| Direct DNA or RNA concentration | Absorbance at 260 nm | UV-capable instrument, matched blank, UV-compatible cuvette, and correct nucleic-acid calculation factor |
| Nucleic-acid purity screening | A260/A280, A260/A230, and full-spectrum review | Ratios must be interpreted together with concentration, buffer, extraction chemistry, and spectral shape |
| Direct measurement of a relatively pure protein | Absorbance at 280 nm | Known or estimated protein-specific extinction coefficient and low interference from nucleic acids or other UV-absorbing compounds |
| Protein in lysate or complex mixture | Bradford, BCA, Lowry, or another validated assay | Compatible reagents, suitable protein standard, standard curve, and interference assessment |
| Very small DNA or RNA volume | Microvolume spectrophotometer or compatible microvolume cell | Confirmed minimum volume, optical height, pathlength, and holder compatibility |
| Low-concentration or analyte-selective nucleic-acid measurement | Fluorescence assay | Compatible dye, fluorometer, standards, and assay-specific range |
| Visible colorimetric protein assay only | VIS or UV-Vis spectrophotometer | The instrument must cover the assay wavelength, such as 595 nm for many Bradford workflows |
How UV-Vis Quantification Works

Beer-Lambert Law and Optical Pathlength
UV-Vis concentration measurements are based on the Beer-Lambert relationship:
A = ε × c × l
- A is absorbance.
- ε is the molar absorptivity or extinction coefficient.
- c is concentration.
- l is optical pathlength.
The equation assumes that the sample is measured within a suitable linear range and that scattering, stray light, chemical interactions, and matrix effects are adequately controlled.
Do not apply a universal absorbance limit such as 1.5 A to every instrument and method. Samples should be measured within the instrument’s verified photometric range and the laboratory’s validated method range. When absorbance is too high for reliable measurement, dilute the sample and apply the correct dilution factor.
DNA and RNA Measurement at 260 nm
DNA and RNA absorb ultraviolet light strongly near 260 nm. For a 10 mm optical pathlength, commonly used calculation factors include approximately:
- 50 µg/mL per A260 unit for double-stranded DNA
- 33 µg/mL per A260 unit for single-stranded DNA
- 40 µg/mL per A260 unit for RNA
These factors are approximations and should be used only with the correct analysis mode, optical pathlength, and sufficiently pure sample.
Absorbance at 260 nm does not reliably distinguish DNA from RNA in a mixed sample. Free nucleotides, phenol, guanidine, turbidity, extraction reagents, and other UV-absorbing compounds may also increase the apparent concentration.
A260/A280 and A260/A230 Ratios
The A260/A280 ratio is commonly used as a screening indicator for nucleic-acid purity. Values near 1.8 are often associated with relatively pure DNA, while values near 2.0 are often associated with relatively pure RNA.
The A260/A230 ratio is also used to screen for contamination from compounds such as phenol, carbohydrates, guanidine salts, and extraction reagents. Values near approximately 2.0–2.2 are commonly expected for well-purified nucleic acid.
These ratios are not definitive proof of purity. They can be influenced by:
- Sample concentration
- Blank solution
- Buffer pH
- Ionic strength
- Extraction chemistry
- Residual phenol or guanidine
- Baseline quality
- Particles or turbidity
At low nucleic-acid concentrations, small absorbance variations can produce large changes in calculated ratios. Review the complete spectrum and downstream performance instead of accepting or rejecting a sample based only on A260/A280.
Concentration, Purity, and Integrity Are Different
A conventional UV-Vis measurement can estimate concentration and provide spectral purity indicators. It does not directly determine:
- DNA fragment size
- DNA degradation
- RNA integrity
- Amplifiability
- Presence of correctly adapted sequencing-library molecules
Use electrophoresis, capillary analysis, fragment analysis, qPCR, dPCR, or another appropriate method when integrity or functional quality must be evaluated.
Protein Quantification Methods
Direct Protein Measurement at 280 nm
Proteins absorb at 280 nm mainly because of aromatic amino acids such as tryptophan and tyrosine, with additional contribution from disulfide bonds.
Direct A280 measurement is most appropriate when:
- The protein is relatively pure.
- The protein-specific extinction coefficient is known or can be estimated.
- Nucleic acids and other UV-absorbing contaminants are absent or adequately controlled.
- The sample concentration falls within the verified photometric range.
Direct A280 is fast and reagent-free, but it is not equally accurate for every protein. Different proteins contain different amounts of aromatic amino acids and therefore produce different absorbance responses at the same mass concentration.
Bradford Assay
The Bradford assay uses dye binding to produce a measurable color change, commonly read near 595 nm. It is fast and sensitive, but the response can vary between proteins and may be affected by detergents and other sample components.
BCA Assay
The BCA assay uses copper reduction followed by color formation. It can provide a broad working range and often shows less protein-to-protein variation than Bradford, but reducing agents, chelators, and some buffers may interfere.
Lowry and Other Colorimetric Methods
Lowry and related assays can provide useful sensitivity, but they involve additional reaction steps and may be affected by sample composition.
No colorimetric method is universally more accurate than every other method. Selection should be based on:
- Expected protein concentration
- Sample matrix
- Detergents and reducing agents
- Available sample volume
- Required sensitivity
- Protein standard
- Incubation time and temperature
Standard Curves and Protein Standards
Bradford, BCA, Lowry, and similar assays require a standard curve. Use a standard that behaves as similarly as possible to the unknown sample.
Bovine serum albumin is widely used, but the assay response of an unknown protein may differ from the response of BSA. The laboratory should define the standard, blank, curve range, replicate criteria, and acceptable fit.
Instrument Requirements for Reliable Measurements

Photometric Accuracy and Linearity
Photometric performance directly affects concentration measurements. Evaluate:
- Absorbance or transmittance accuracy
- Repeatability
- Verified linear range
- Noise
- Baseline stability
- Drift
A published maximum absorbance range does not prove equal accuracy across the full range. Request verification data near the absorbance levels used in your methods.
Stray Light
Stray light can cause negative deviation from Beer-Lambert behavior at high absorbance. Lower published stray-light values may support a wider usable photometric range, but the practical result must still be verified at the wavelengths and absorbance levels used by the method.
Do not rank instruments using only a single stray-light number. The test wavelength, filter, method, optical design, detector, and photometric verification procedure must also be considered.
Wavelength Accuracy and Repeatability
Wavelength accuracy supports reproducible measurement at 230, 260, 280, and assay-specific visible wavelengths.
Nucleic-acid spectra around 260 nm are not extremely narrow isolated peaks. Therefore, a ±1 nm difference should not automatically be described as causing a major concentration error in every sample.
Reliable results depend on the combined performance of wavelength accuracy, photometric accuracy, linearity, bandwidth, blank matching, cuvette quality, and sample preparation.
Spectral Bandwidth
A narrower spectral bandwidth can provide better spectral resolution. However, the practical difference between 2 nm and 4 nm bandwidth for routine A260/A280 measurements should be confirmed through method performance data.
The 4 nm bandwidth of the AE-SP1000 should not automatically be described as unacceptable. It may be suitable for routine or educational work when verified against the laboratory’s requirements.
Single-Beam, Split-Beam, and Double-Beam Designs
In a single-beam instrument, the blank and sample are normally measured sequentially through one optical path. Re-blanking may be required when operating conditions change.
A double-beam design uses sample and reference optical channels to compensate for lamp or optical fluctuations. However, the exact architecture varies by manufacturer.
The term split beam should not automatically be treated as identical to every double-beam design. Before comparing optical stability, request:
- Optical diagram
- Number of detectors
- Sample and reference measurement sequence
- Whether both channels are measured simultaneously
- Baseline and drift specifications
Software and Data Integrity
Built-in DNA/protein modes can simplify calculations, but they do not guarantee analytical validity. Confirm:
- Available nucleic-acid factors
- Protein calculation methods
- Standard-curve capability
- Raw-spectrum storage
- CSV or PDF export
- User accounts and access control
- Audit trail
- Method locking and version control
- LIMS or network connectivity
Instrument verification functions and exportable records may support GLP-aligned workflows, but they do not by themselves establish full GLP or regulated-environment compliance.
Cuvette and Sample-Handling Requirements
Quartz, Glass, and Plastic Cuvettes
Measurements at 260 and 280 nm require a cuvette that transmits ultraviolet light at the selected wavelength.
UV-grade quartz is commonly used for nucleic-acid and direct protein measurements. Standard optical glass and many disposable plastic cuvettes may not transmit adequately at 260 nm.
For colorimetric protein assays measured in the visible region, compatible glass or plastic cuvettes may be suitable. Always check the cuvette’s specified transmission range.
Pathlength and Sample Volume
A 10 mm optical pathlength does not automatically require 1 mL of sample. Required volume depends on:
- Internal cuvette width
- Optical window height
- Beam height
- Macro, semi-micro, micro, or ultra-micro design
- Required mixing or temperature-control space
Standard macro cuvettes may require approximately milliliter volumes, while semi-micro and micro cuvettes can use substantially less sample while retaining a 10 mm pathlength.
Adjustable Holders and Microvolume Compatibility
An adjustable 5–50 mm or 10–50 mm sample holder means the instrument can accommodate several cuvette pathlengths. It does not prove compatibility with every micro or ultra-micro cell.
Before purchasing an accessory, confirm:
- External cell dimensions
- Optical height
- Minimum sample volume
- Pathlength
- Required adapter
- Instrument beam dimensions
For very small sample volumes, a dedicated micro volume spectrophotometer may provide a simpler workflow than a conventional cuvette-based instrument.
Use a Matched Blank
The blank should contain the same buffer, solvent, reagents, pH, and ionic strength as the sample, excluding the analyte.
Using water as the blank for a sample dissolved in TE, EB, extraction buffer, Bradford reagent, or BCA reagent may produce incorrect baselines or concentration results.
Dilution and Mixing
Dilute samples when their absorbance falls outside the verified method range. Use calibrated pipettes, mix thoroughly, avoid bubbles, and apply the correct dilution factor.
For colorimetric assays, keep reaction time, temperature, reagent ratio, and mixing conditions consistent between standards and unknown samples.
AELAB UV-Vis Spectrophotometer Comparison
The table below summarizes current public product information. It is intended for preliminary comparison only. Public inconsistencies in the AE-SP4000 and AE-SP5000 pages must be resolved through an updated datasheet or written technical confirmation before purchase.
| Model | Public Optical-System Information | Wavelength Range | Bandwidth | Wavelength Accuracy | Stray Light | DNA/Protein Workflow |
|---|---|---|---|---|---|---|
|
AE-SP1000 |
Single beam | VIS: 320–1100 nm UV: 190–1100 nm |
4 nm | ±2 nm | <0.2%T at the published test wavelengths | UV model can measure 260/280 nm; confirm whether dedicated DNA/protein calculation software is included in the ordered configuration |
|
AE-SP2000 |
Single beam | VIS: 320–1100 nm UV: 190–1100 nm |
2 nm | ±1 nm | ≤0.1%T at the published test wavelengths | Built-in DNA/protein measurement mode is listed |
|
AE-SP3000 |
Single beam | VIS: 320–1100 nm UV: 190–1100 nm |
2 nm | ±0.5 nm | ≤0.1%T at the published test wavelengths | DNA/protein and quantitative workflows are listed; 5–50 mm adjustable holder |
|
AE-SP4000 |
Public conflict: product title and overview say double beam, while the specification table says single beam | Public conflict: the current table shows 320–1100 nm under UV and 190–1100 nm under VIS. Request corrected model labeling. | 2 nm | ±0.3 nm | ≤0.05%T at the published test wavelengths | DNA/protein measurement is listed; optical configuration must be confirmed |
|
AE-SP5000 |
Specification table says split beam; product title markets the series as double beam. Public description states that sample and reference signals are measured to compensate for fluctuation. | Public conflict: the current table shows 320–1100 nm under UV and 190–1100 nm under VIS. Request corrected model labeling. | 2 nm | ±0.3 nm | ≤0.05%T at the published test wavelengths | DNA/protein measurement and split-beam operation are listed |
Comparison note: The UV version selected for direct DNA, RNA, or protein A280 measurement must include 260 and 280 nm. Do not rely on the currently reversed UV/VIS labels shown on the public AE-SP4000 and AE-SP5000 tables.
-
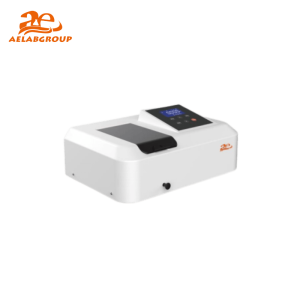 AELAB AE-SP1000 Series Visible / UV-Visible Spectrophotometer – Precision Optical MeasurementRead more
-
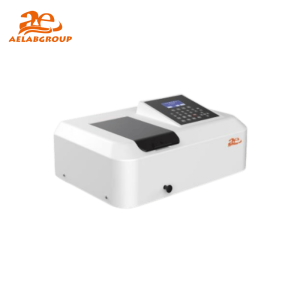 AELAB AE-SP2000 Series UV-Visible Spectrophotometer for quantitative and kinetic analysisRead more
-
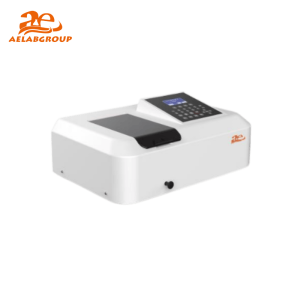 AELAB AE-SP3000 Series UV-Visible Spectrophotometer – High-Precision Absorbance and Transmittance AnalysisRead more
-
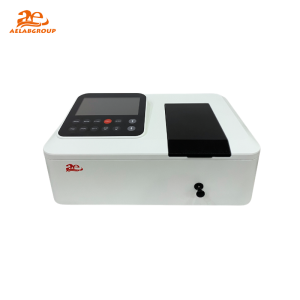 AELAB AE-SP4000 Series Double-Beam UV-Visible Spectrophotometer for High-Accuracy Optical MeasurementRead more
-
 AELAB AE-SP5000 Series Double-Beam UV-Visible Spectrophotometer for High-Precision Optical AnalysisRead more
Important Product-Data Clarifications
AE-SP4000 Optical-System Description
The current AE-SP4000 product title and overview describe the model as double beam, while the public specification table lists a single-beam optical system.
Before comparing it with other instruments, request:
- Current technical datasheet
- Optical-path diagram
- Number of detectors
- Reference-channel description
- Written confirmation of the supplied optical configuration
AE-SP4000 and AE-SP5000 UV/VIS Labels
The current public tables for AE-SP4000 and AE-SP5000 display 320–1100 nm under the UV variant and 190–1100 nm under the VIS variant. This conflicts with normal model naming and with the requirement to measure DNA and protein at 260 and 280 nm.
The corrected range and model code should be confirmed before the instrument is quoted, ordered, or described in Product Schema.
AE-SP5000 Split-Beam Description
The AE-SP5000 specification table lists a split-beam system, while the product title refers to a double-beam series. The public description states that incident light is divided into sample and reference beams.
Request the optical diagram to determine whether the design and detector arrangement meet the laboratory’s baseline, kinetic, and reference-compensation requirements.
Which AELAB Spectrophotometer Fits Your Laboratory?
AE-SP1000: Basic Absorbance and Teaching Applications
The AE-SP1000 may suit educational laboratories and routine absorbance work where its published wavelength accuracy, bandwidth, and photometric performance meet the method requirements.
Choose the UV model when direct A260 or A280 measurement is required. The VIS model cannot measure DNA or RNA directly at 260 nm.
AE-SP2000: Routine Life-Science Workflows
The AE-SP2000 UV model may suit laboratories that need:
- 190–1100 nm coverage
- 2 nm bandwidth
- Built-in DNA/protein calculations
- Standard-curve quantification
- Spectrum and time scanning
- USB and CSV data export
AE-SP3000: Improved Wavelength Performance and Flexible Cuvettes
The AE-SP3000 UV model may suit laboratories that need improved published wavelength accuracy, a touchscreen, DNA/protein workflows, and a 5–50 mm adjustable cuvette holder.
Confirm the specific micro or ultra-micro cell accessory rather than assuming that every low-volume cell fits the standard holder.
AE-SP4000: High Published Photometric Specifications with Unresolved Product Data
The AE-SP4000 lists strong wavelength, transmittance, stray-light, drift, and baseline specifications. However, its current public optical-system and wavelength-range descriptions are internally inconsistent.
Do not select it based on the Double-Beam title until the supplied optical design and corrected model ranges are confirmed in writing.
AE-SP5000: Split-Beam System for More Demanding Workflows
The AE-SP5000 public specifications list a split-beam optical system, ±0.3 nm wavelength accuracy, low published stray light, CSV output, and DNA/protein applications.
It may suit laboratories that require improved baseline and long-term stability, subject to verification of the actual optical architecture, correct UV model, software controls, and application performance.
When to Choose a Conventional UV-Vis or a Microvolume Instrument
| Requirement | Conventional Cuvette UV-Vis | Microvolume Spectrophotometer |
|---|---|---|
| Sample volume | Depends on cuvette design; often tens of microliters to milliliters | Usually approximately 0.5–2 µL, depending on model |
| Colorimetric protein assays | Well suited to standard cuvette assays and standard curves | Possible on some models, but reagent, pathlength, and volume compatibility must be checked |
| Kinetic measurements | May support temperature-controlled or multi-cell kinetic workflows | Often intended for rapid endpoint measurements |
| Very limited sample volume | Requires micro or ultra-micro cuvette accessory | Designed specifically for very small samples |
| Broad UV-Vis application range | Suitable for many chemical, biochemical, environmental, and QC assays | Primarily optimized for small-volume life-science measurements |
If your main requirement is very small-volume DNA or RNA measurement, review the Micro Volume Spectrophotometer for DNA/RNA Quantification Guide.
For planning a broader laboratory workflow, see:
- Biotechnology Laboratory Setup: Essential Research Equipment
- Essential Equipment for Molecular Biology Laboratories
Information to Confirm Before Purchase
Provide the following information when requesting a UV-Vis configuration:
- DNA, RNA, protein, or colorimetric assay type
- Required wavelengths
- Expected absorbance and concentration range
- Typical sample volume
- Cuvette material, dimensions, and pathlength
- Need for micro, semi-micro, or ultra-micro cells
- Required standard-curve functions
- Need for kinetic measurements
- Need for temperature-controlled cuvettes
- Number of samples per batch
- Required data-export format
- Need for user accounts, audit trail, or LIMS connection
- Applicable GLP, GMP, ISO, pharmacopeial, or internal quality requirements
- Required performance-verification standards
Need help selecting a UV-Vis spectrophotometer?
Send AELAB your assay type, required wavelengths, concentration range, sample volume, cuvette requirements, standard-curve needs, and data-management expectations. The technical team can confirm the suitable SP model, UV or VIS configuration, accessories, and software scope.
Conclusion
Reliable DNA, RNA, and protein quantification requires the correct combination of analytical method, wavelength range, cuvette, pathlength, blank, photometric performance, and software workflow.
A260/A280 and A260/A230 are useful screening indicators, but they are not definitive proof of nucleic-acid purity. Direct A280 can be effective for relatively pure proteins when an appropriate extinction coefficient is available, while Bradford, BCA, Lowry, and similar methods require validated standard curves and interference control.
The AE-SP1000, AE-SP2000, and AE-SP3000 public specifications provide relatively clear UV and VIS model ranges. The AE-SP4000 and AE-SP5000 pages currently contain model-labeling or optical-system inconsistencies that should be corrected or confirmed before purchase.
Next step: Define your assay wavelengths, sample volume, concentration range, cuvette type, data requirements, and quality-system expectations. Request a quotation that clearly identifies the optical system, UV/VIS range, accessories, software functions, and verified performance.
Frequently Asked Questions
Can a VIS-only spectrophotometer measure DNA or RNA?
No. Direct DNA and RNA absorbance measurements require 260 nm, which is outside the range of a typical VIS-only instrument covering approximately 320–1100 nm.
Can a VIS spectrophotometer measure protein concentration?
It can measure colorimetric protein assays when the assay wavelength falls within its visible range. It cannot perform direct protein A280 measurement without UV capability.
Is A260/A280 proof that DNA is pure?
No. It is a screening indicator. Interpret it together with A260/A230, the full spectrum, concentration, blank, extraction chemistry, and downstream performance.
When is direct A280 suitable for protein quantification?
Direct A280 is most suitable for relatively pure proteins when the protein-specific extinction coefficient is known or can be estimated and interfering UV-absorbing compounds are adequately controlled.
What is the difference between Bradford and BCA assays?
Bradford uses dye binding and is commonly measured near 595 nm. BCA uses copper reduction and color formation. Their working ranges and susceptibility to detergents, reducing agents, chelators, and protein-to-protein variation differ.
Which cuvette material is required at 260 nm?
Use a cuvette confirmed to transmit UV light at 260 nm. UV-grade quartz is commonly used. Standard glass and many plastic cuvettes are not suitable at this wavelength.
Does a 10 mm cuvette always require 1 mL?
No. Required volume depends on the cuvette’s internal dimensions and optical window height. Semi-micro and micro cuvettes can retain a 10 mm pathlength while using much less than 1 mL.
Does an adjustable sample holder support every ultra-micro cuvette?
No. Confirm the cell’s dimensions, optical height, pathlength, minimum volume, and required adapter for the selected instrument.
When should a sample be diluted?
Dilute the sample when its absorbance exceeds the verified linear range of the instrument or method. Apply the correct dilution factor and use a matched blank.
What is the difference between single-beam and double-beam instruments?
A single-beam instrument normally measures blank and sample sequentially. A double-beam design uses sample and reference channels to compensate for optical fluctuations. The exact implementation depends on the manufacturer’s optical architecture.
Is a split-beam instrument the same as a double-beam instrument?
Not necessarily. The terms may describe different optical and detector arrangements. Review the optical diagram, detector configuration, and reference-measurement method.
Is the AE-SP4000 single beam or double beam?
The current public page is inconsistent: its title and overview say double beam, while its technical table lists single beam. Request written confirmation and the current optical diagram.
Which wavelength range applies to AE-SP4000 and AE-SP5000?
The current public tables appear to reverse the UV and VIS range labels. Confirm the corrected datasheet and ensure that the selected UV model includes 260 and 280 nm.
Do GLP verification functions make an instrument fully compliant?
No. Verification functions and exportable results may support a GLP-aligned workflow, but full compliance may also require validated methods, controlled user access, audit trails, electronic-record controls, SOPs, training, and quality-system documentation.
Technical References
-
AELAB AE-SP1000 Series — Published Product Information
-
AELAB AE-SP2000 Series — Published Product Information
-
AELAB AE-SP3000 Series — Published Product Information
-
AELAB AE-SP4000 Series — Published Product Information
-
AELAB AE-SP5000 Series — Published Product Information
-
Thermo Fisher Scientific — Nucleic Acid and Protein Purity Analysis Resources
-
Thermo Fisher Scientific — Protein A280 and Colorimetric Assay Applications
-
Thermo Fisher Scientific — Overview of Protein Assay Methods
-
Hellma Analytics — Cuvette Materials and UV Transmission
-
Agilent — UV-Vis and UV-Vis-NIR Spectroscopy Basics